Tag: visual organizers
How to Teach Venn Diagrams to Elementary School Students
Venn Diagrams are one of the most visual approaches to showing students the logical relationships between sets and connectivity of data. It uses overlapping circles to show the wholeness of data and then where they overlap other data sets. It’s easy to find templates for them–in MS Office, Google Apps, Canva, and more.
One of our Ask a Tech Teacher crew has organized the basics on how to teach Venn Diagrams to elementary-age students:
- What is a Venn Diagram
- How to make it digitally
- How to make it clear to elementary students (get crafty)
- How to use it to design games
How to Teach Venn Diagrams to Elementary School Students
Teaching children Venn diagrams is the beginning of teaching them how to sort and manage data, a skill that is becoming ever more useful in this technological era. However, finding a way to teach them that sticks is important – generic worksheets just won’t do! We’ve come up with a few ways you can teach elementary school students Venn diagrams that will make your lessons dynamic and fun.
https://pixabay.com/photos/school-draw-drawing-education-1974369/
What is a Venn Diagram?
It’s important to make sure you first understand what a Venn diagram is. A Venn diagram is a plot of overlapping circles that can display items via specific categories, as well as relationships. For example, you can have a Venn diagram representing blue eyes with one circle, and brown hair with another circle. Those with blue eyes but not brown hair will end up in only the segment for blue eyes; those with brown hair but not blue eyes will be placed only in the segment for brown hair. Those with blue eyes and brown hair will be placed in the segment created by the overlap of the two circles.
This is a fun concept to teach to children because it’s a visual method, so it isn’t difficult to find something both visual and interactive to make sure it’s memorable. Now for the methods!
Make it Digital
With technology becoming the main focus of life, especially for the younger generation, one of the best ways to connect and share ideas is through technology. This means using digital tools and accessing an online venn diagram can be incredibly helpful for many reasons. Firstly, it allows you to project what you’re describing on your smartboard or interactive whiteboard, allowing you to demonstrate to the class what you mean. It makes a good start!
Share this:
Game-based Learning in Remote Teaching
Storyboard That–Digital Storyteller, Graphic Organizer, and more
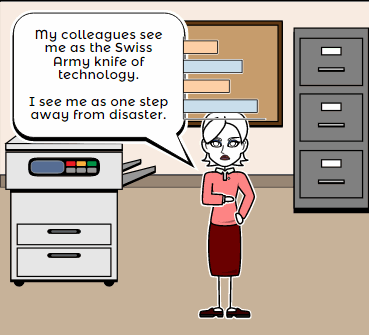 Storyboard That is a leader among online digital storytelling tools thanks to its comic-based themes, clean layout, vast collection of story pieces, varied strip options, and intuitive drag-and-drop interface. Students can map out ideas, write stories, or relay events in a comic format using Storyboard That’s huge library of backgrounds, characters, text boxes, shapes, and images. When you sign up as a teacher, you get a dashboard to manage students and support for Google sign-in. You also get teacher guides and lesson plans on subjects like English (Of Mice and Men), school social skills (like bullying), World History, US History, Special Education, and languages (like Teaching Spanish). Lesson plans include how-to steps, Common Core alignment, sample storyboard layouts, synopsis, and Essential Questions.
Here’s how it works: Log into your account from any device (laptop, desktop–Mac or Windows–Chromebook, iPad, or even a smartphone) and Storyboard That automatically adapts to your device using its HTML5 responsive web design. Students can join with an access key supplied by the teacher–no email required–or be bulk-added by the administrator. Select the frame layout you’d like with any number of scenes, then add a background, characters, one or more props, and speech bubbles from Storyboard That’s image banks (of over 325 characters, 225 scenes, and over 45,000 images). Each element can be resized, rotated, and repositioned. Characters can be posed with flexibility at all joints, and adjusted for appearance and emotion. You can even upload images to use in the strip, add photos from the millions available through Photos for Class (including citations), and record a voice overlay (premium only) to narrate the story. Once finished, storyboards can be saved as PDFs, storyboard cells, PowerPoint presentations, and/or emailed out.
Beyond the traditional strip layout, Storyboard That offers graphic organizers such as a T-chart, a Grid, a Frayer Model, a Spider Map and a Timeline (premium and education account).This is great for visual learners who thrive on color and images.
Share this:
Teach Animal Adaptations with an MS Word Diagram
This project is part of a triptych that collaborates with a classroom unit on animals. The first was another diagram, that one to teach animal characteristics.
This one is a great project that mixes the visual with the written. Students loved collaborating to come up with the animal adaptations. Allow them to take ample time surveying the plethora of amazing animal pictures that represent the adaptations they selected. Overall a popular project that teaches a lot. Easily completed in 30 minutes. (more…)
Share this:
#45: How to Use MS Word to Teach Geography
Where Am I?
Use MS Word target diagram to organize the Universe. Start with the student’s town in the center and build out. Show students how to color the diagram. For olders, add a table at the bottom with the location and a fact about it. This is a great way to show kids how they can organize their thoughts with pictures, diagrams, tables—lots of ways other than simple text
[caption id="attachment_929" align="alignleft" width="182"]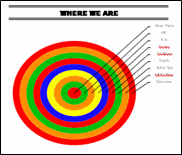 Sample diagram[/caption]
Grade Level: 3-5
Background: Using MS Word.
Vocabulary: diagram, graphic organizer, solar system
Time: About 30 minutes
Steps:
- Open MS Word. Add a heading to the top.
- Add a title–Where We Are–centered, bold and font 14. Use this to point out the toolbar with the four alignment tools, bold, fonts and font size (more…)
Share this:
How to Use MS Word to Teach Geography
 Sample diagram[/caption]
Grade Level: 3-5
Background: Using MS Word.
Vocabulary: diagram, graphic organizer, solar system
Time: About 30 minutes
Steps:
- Open MS Word. Add a heading to the top.
- Add a title–Where We Are–centered, bold and font 14. Use this to point out the tool bar with the four alignment tools, bold, fonts and font size (more…)


